THERANOS
Revolutionizing Healthcare Through Micro-Sampling
Investor Pitch Deck
Prepared by
Aurora Capital Partners
Investment Banking Division
Valuation
$9.0B
Tests
1,000+
Concordance
99.4%
November 2026 · Confidential — For Invited Investors Only · v1.2
Confidential — For Invited Investors OnlyTheranos, Inc. · Investor Pitch Deck
Executive Summary & The Ask
Investment opportunity in one slide
Thesis: Theranos is building the first consumer-facing, micro-sampling diagnostics platform that collapses cost, pain, and turnaround time — positioning it to capture share of a $75B global market at 65%+ gross margins.
- Proprietary platform: dozens of assays from a few drops of capillary blood
- 99.4% concordance across 1,042 samples; 7 assays validated, 1,000+ menu target
- Path to $1.8B revenue by 2030; break-even 2027 on base case
- 100+ patents; CLIA-certified; FDA 510(k) pathway initiated
The Ask
$200M Series E
$9.0B pre-money valuation · Common + Preferred equity (Series E Preferred)
Use of Proceeds
Source: company operating plan; proceeds net of fees.
Runway
24 mo
Break-even
2027
Gross Margin
65%+
Confidential — For Invited Investors OnlyTheranos, Inc. · Investor Pitch Deck
Investment Highlights
Compelling opportunity in consumer diagnostics
- Proprietary micro-sampling platform — comprehensive tests from a few drops of blood
- Miniaturized, automated laboratory (Edison) — results in minutes, not days
- 99.4% concordance vs. reference labs across 1,042 samples; 7 assays validated
- Addressing a $75B+ global diagnostics market with significant unmet need
- Strong IP portfolio — 100+ patents; CLIA-certified operations
- Path to $1.8B revenue by 2030 with 65%+ gross margins
- Experienced board of public servants, clinicians and operators
Market Opportunity ($B) — Frost & Sullivan 2026
Projected Revenue 2026–2030 ($M)
Confidential — For Invited Investors OnlyTheranos, Inc. · Investor Pitch Deck
Market Opportunity
Sizing, segmentation, and competitive landscape
Confidential — For Invited Investors OnlyTheranos, Inc. · Investor Pitch Deck
Market Sizing & Segmentation
Bottom-up methodology, third-party sourced
| Tier | Value ($B) | Definition / Method |
|---|---|---|
| TAM | 75 | Global in-vitro diagnostics market (Frost & Sullivan 2026) |
| SAM | 12 | US retail/wellness & consumer-accessible testing |
| SOM | 2 | 5-yr capture: 200-1,000 sites × 200 tests/day × $10 × 250 days |
SOM bridge: 50 sites (2026) → 1,000 sites (2030); 200 tests/site/day; $10 price; 250 operating days.
Segmentation
| Segment | Share of SAM | Margin profile | Buyer |
|---|---|---|---|
| Consumer wellness | 45% | High (65%+) | Self-pay consumer |
| Clinical diagnostics | 35% | Mid (55-60%) | Physicians / health systems |
| Pharma trials | 20% | Premium (70%+) | Sponsors / CROs |
SAM by Segment ($B)
Source: Frost & Sullivan 2026; company segmentation.
Growth Drivers
- Consumerization of diagnostics & price transparency
- Shift from venipuncture to capillary micro-sampling
- Value-based care / early detection incentives
- Pharma demand for decentralized trial endpoints
Confidential — For Invited Investors OnlyTheranos, Inc. · Investor Pitch Deck
Competitive Landscape
Why Theranos wins
| Player | Modality | Price / test | Turnaround | Menu | Theranos advantage |
|---|---|---|---|---|---|
| Quest Diagnostics | Venipuncture, centralized | $40-120 | 1-3 days | 3,000+ | Cost, speed, access |
| LabCorp | Venipuncture, centralized | $40-120 | 1-3 days | 5,000+ | Cost, speed, access |
| Abbott (point-of-care) | Cartridge, device | $15-40 | Minutes | ~30 | Menu breadth, cost |
| Genomics startups | Finger-prick / mail-in | $99-299 | Days-weeks | Niche | Speed, price, breadth |
| Theranos | Micro-sampling + Edison | $10 | Minutes | 7 → 1,000+ | — |
Moat & Differentiation
- 100+ patents (device, cartridge, collection, software)
- Proprietary microfluidic reagent integration
- CLIA-certified operations & quality systems
- Data network effects from high-frequency testing
Switching costs / barriers
- Installed Edison base + cartridge consumables
- Physician/patient familiarity with reports
- Payer coverage & CPT code establishment
- Regulatory clearances (510(k)/PMA)
Confidential — For Invited Investors OnlyTheranos, Inc. · Investor Pitch Deck
Technology & Product
Platform, roadmap, and cost advantage
Confidential — For Invited Investors OnlyTheranos, Inc. · Investor Pitch Deck
The Theranos System
Equipment & Technology
EDISON ANALYZER
Edison Analyzer
Cartridge Slot
Nanotainer
Miniaturized, automated laboratory processing dozens of tests from one sample.
Edison Analyzer
Miniaturized, automated lab processing dozens of tests from one sample.
Theranos Cartridge
Proprietary microfluidic cartridge: sample prep, reagents, detection.
Finger-Stick Collection
Patented device capturing a few drops of capillary blood — painless.
Nanotainer
Proprietary vessel preserving sample integrity door-to-door.
Software Platform
Cloud-based results to patients & physicians in minutes.
CLIA-Certified Lab
Fully regulated lab operations & quality systems.
Cost per Test ($)
Product Roadmap
2026Launch 7 assays · US retail
202730+ assays · wellness centers
2028International expansion
2029Hospital partnerships
2030Full menu · 1,000+ sites
Assay count by year: 7 → 30 → 120 → 400 → 1,000+
Confidential — For Invited Investors OnlyTheranos, Inc. · Investor Pitch Deck
Clinical Validation
Concordance vs. reference lab — 1,042 samples
| Assay | Theranos | Reference Lab | Concordance | Status |
|---|---|---|---|---|
| CBC (WBC) | 7.2 K/µL | 7.1 K/µL | 99.4% | Pass |
| Glucose | 94 mg/dL | 95 mg/dL | 99.6% | Pass |
| Total Cholesterol | 188 mg/dL | 186 mg/dL | 99.1% | Pass |
| HDL Cholesterol | 58 mg/dL | 59 mg/dL | 99.3% | Pass |
| Triglycerides | 112 mg/dL | 110 mg/dL | 99.5% | Pass |
| HbA1c | 5.4 % | 5.4 % | 99.8% | Pass |
| TSH | 2.1 mIU/L | 2.0 mIU/L | 99.2% | Pass |
Study design: prospective, multi-site, blinded comparison vs. FDA-cleared reference analyzers; n=1,042 (adults 18-80); IRB-approved; CLIA lab. Metrics: concordance, sensitivity/specificity, LOD, precision (CV <5%) reported in appendix.
Assay Menu Roadmap (count by year)
Source: company R&D plan; assay count includes immunoassay, chemistry, hematology.
Concordance by Assay (%)
Confidential — For Invited Investors OnlyTheranos, Inc. · Investor Pitch Deck
Regulatory & Reimbursement
Pathway, quality systems, and payer strategy
Regulatory pathway
| Jurisdiction | Status | Pathway |
|---|---|---|
| US FDA | In progress | 510(k) for Edison; PMA for novel assays |
| CLIA | Certified | High-complexity lab; quality systems |
| State licenses | CA, AZ, NY | State-by-state licensure |
| CE Mark (EU) | Planned 2028 | IVDR conformity |
| ISO 13485 | Certified | QMS |
Regulatory timeline subject to agency review; PMA adds 12-18 months.
Reimbursement strategy
| Item | Detail |
|---|---|
| CPT codes | Leverage existing codes (85025, 80053, 83036, 84443) |
| Medicare | CLFS rates; gap-fill where needed |
| Commercial payers | Contracting in progress (2 of top 5) |
| Self-pay | $10 flat price; cash-pay wellness |
| Pharma | Per-sample fee in trials |
Revenue mix by payer (2030, base)
Confidential — For Invited Investors OnlyTheranos, Inc. · Investor Pitch Deck
Team & Governance
Leadership, board, and scientific advisors
Confidential — For Invited Investors OnlyTheranos, Inc. · Investor Pitch Deck
Team & Board of Directors
Leadership and governance
Elizabeth Holmes
Founder & Chief Executive Officer
Founded Theranos in 2003; vision for consumer-accessible diagnostics. Stanford dropout; drives product and strategy.
Sunny Balwani
President & Chief Operating Officer
Oversees operations, manufacturing scale-up, and commercial execution. Background in software and operations.
Henry Kissinger
Board Member
Former US Secretary of State; geopolitical and strategic counsel.
George Shultz
Board Member
Former US Secretary of State & Treasury; governance and public policy.
Bill Frist, MD
Board Member
Former US Senate Majority Leader; cardiothoracic surgeon; healthcare policy.
Sam Nunn
Board Member
Former US Senator; national security and governance.
Gary Roughead
Board Member
Admiral (Ret.), US Navy; operations and logistics.
Scientific Advisors
KOL Panel
Mix of clinical chemists, pathologists, and biostatisticians advising on assay validation and study design.
Bios summarized; full CVs in data room. Board independence and audit committee to be strengthened pre-IPO.
Confidential — For Invited Investors OnlyTheranos, Inc. · Investor Pitch Deck
Financials
Unit economics, projections, scenarios, and runway
Confidential — For Invited Investors OnlyTheranos, Inc. · Investor Pitch Deck
Unit Economics Build-Up
From price per test to revenue
| Driver | Value | Notes |
|---|---|---|
| Price per test | $10 | Flat consumer price; payer rates vary |
| Cost per test | $2.50 | Reagent + cartridge + labor |
| Gross margin per test | 75% | At scale; 58% in 2026 |
| Tests / site / day | 200 | 2 shifts, 1 Edison, 8 hr |
| Operating days / yr | 250 | Excl. downtime |
| Utilization | 60% (2026) → 85% | Ramp by site maturity |
Revenue = sites × tests/site/day × price × operating days × utilization.
Revenue bridge (2030 base, $M)
Site ramp
| Year | Sites | Tests/site/day | Utilization | Revenue ($M) |
|---|---|---|---|---|
| 2026 | 50 | 200 | 60% | 50 |
| 2027 | 200 | 200 | 70% | 180 |
| 2028 | 500 | 200 | 75% | 420 |
| 2029 | 800 | 200 | 80% | 900 |
| 2030 | 1,000+ | 200 | 85% | 1,800 |
Price held at $10; payer mix shift improves realized price to ~$12 by 2030.
Gross margin drivers
- Reagent cost curve: -8%/yr with volume
- Cartridge yield improvement: 85% → 95%
- Fixed lab overhead spread over volume
- Premium pharma pricing mix
Confidential — For Invited Investors OnlyTheranos, Inc. · Investor Pitch Deck
Financial Projections & Scenarios
Base / Bull / Bear
| Scenario | 2026 Rev | 2028 Rev | 2030 Rev | 2030 GM | 2030 EBITDA | Sites 2030 |
|---|---|---|---|---|---|---|
| Bear | 30 | 250 | 900 | 60% | 180 | 600 |
| Base | 50 | 420 | 1,800 | 70% | 620 | 1,000+ |
| Bull | 70 | 600 | 2,500 | 72% | 950 | 1,400 |
EBITDA Trajectory ($M) — Base
| 2026 | 2027 | 2028 | 2029 | 2030 | |
|---|---|---|---|---|---|
| Revenue | 50 | 180 | 420 | 900 | 1,800 |
| Gross Margin | 58% | 62% | 65% | 68% | 70% |
| EBITDA | (20) | 15 | 80 | 240 | 620 |
| Sites | 50 | 200 | 500 | 800 | 1,000+ |
| Headcount | 400 | 900 | 1,600 | 2,400 | 3,200 |
P&L detail, cash flow, balance sheet in appendix. Valuation: $9B = 5x 2030 revenue / 14.5x 2030 EBITDA (comps: diagnostic services 4-6x rev).
Confidential — For Invited Investors OnlyTheranos, Inc. · Investor Pitch Deck
Burn Rate & Runway
Funding needs and cash plan
| Metric | 2026 | 2027 | 2028 |
|---|---|---|---|
| OpEx ($M) | 70 | 165 | 340 |
| CapEx ($M) | 15 | 30 | 60 |
| Cash burn ($M) | 85 | 150 | 120 |
| Ending cash ($M) | 115 | 165 | 245 |
Series E $200M extends runway 24 months to cash-flow positive (Q4 2027 base).
Cash-flow positive
Q4 2027
Base case; bear case slips to 2029
Monthly burn
$8.3M
Runway
24 mo
Series E
$200M
- Use of proceeds: R&D 35%, commercialization 30%, manufacturing 20%, G&A 15%
- No debt; clean cap table; 1x liquidation preference
- Board observer rights for lead investor
Confidential — For Invited Investors OnlyTheranos, Inc. · Investor Pitch Deck
Risk Factors
Key risks and mitigations
Confidential — For Invited Investors OnlyTheranos, Inc. · Investor Pitch Deck
Risk Factors
Candid assessment for IC diligence
Regulatory
FDA clearance timing and scope; PMA risk for novel assays; state licensure gaps. Mitigation: early agency engagement, CLIA lab, quality systems.
Clinical
Limited menu (7 assays) vs. comprehensive claims; concordance on small n; need larger validation. Mitigation: expanded studies, sensitivity/specificity reporting.
Reimbursement
Payer coverage uncertain; Medicare CLFS rates may not support $10 price. Mitigation: self-pay wellness focus, contracting, CPT leverage.
Competitive
Quest/LabCorp/Abbott can replicate or price-match; scale advantages. Mitigation: IP, speed, consumer brand, installed base.
IP
FTO not fully assessed; patent challenges; trade secret dependence. Mitigation: 100+ patents, continuation filings, confidentiality.
Manufacturing
Cartridge yield, scale-up, supply chain single-source risks. Mitigation: CM qualification, second source, yield programs.
Key person
Dependence on founder/CEO; succession planning immature. Mitigation: board strengthening, executive bench.
Ethics / fraud
Heightened scrutiny of claims; need transparent data and governance. Mitigation: independent validation, audit committee, disclosure discipline.
Confidential — For Invited Investors OnlyTheranos, Inc. · Investor Pitch Deck
Live Pilot Demonstration
Proof of concept with predefined success criteria
A single finger-prick. Results in minutes. No venipuncture, no waiting.
- 1. Finger-prick collection (a few drops)
- 2. Insert cartridge into Edison
- 3. Automated analysis runs
- 4. Results delivered to screen
Success criteria
| Metric | Target | Pass/Fail |
|---|---|---|
| Concordance vs. reference | ≥98% | Pass |
| Turnaround time | ≤15 min | Pass |
| Sample volume | ≤50 µL | Pass |
| Device uptime | ≥95% | Pass |
Conclusion
Theranos is redefining the laboratory — bringing testing closer to the patient, reducing cost and pain, and enabling earlier detection of disease. We invite you to join us in building the future of healthcare.
Thank You
For questions or follow-up, contact:
theranos@halberti.com · halberti.com
Confidential — For Invited Investors OnlyTheranos, Inc. · Investor Pitch Deck
Appendix
Patents, study protocol, detailed P&L, sources
Confidential — For Invited Investors OnlyTheranos, Inc. · Investor Pitch Deck
Appendix A — Patent Portfolio Summary
IP overview (representative)
| Family | Count | Jurisdictions | Status |
|---|---|---|---|
| Micro-sampling collection device | 24 | US, EU, JP, CN | Granted |
| Cartridge / microfluidics | 31 | US, EU | Granted / pending |
| Edison analyzer hardware | 18 | US, EU | Granted |
| Software / cloud platform | 14 | US | Granted / pending |
| Assay methods | 13 | US, EU | Pending |
| Total | 100+ | — | — |
Full patent list, filing dates, and claim charts available in data room. FTO analysis in progress; not yet complete.
Confidential — For Invited Investors OnlyTheranos, Inc. · Investor Pitch Deck
Appendix B — Study Protocol Summary
Clinical validation design
| Element | Detail |
|---|---|
| Design | Prospective, multi-site, blinded comparison |
| Population | n=1,042 adults 18-80; mixed health status |
| Sites | 3 CLIA-certified locations |
| Comparator | FDA-cleared reference analyzers (Quest/LabCorp) |
| Endpoints | Concordance, sensitivity, specificity, LOD, precision (CV) |
| IRB | Approved; informed consent obtained |
| Assays | 7 (CBC, Glucose, Chol, HDL, Trig, HbA1c, TSH) |
Full protocol, SAP, and data tables available in data room. Independent replication pending.
Confidential — For Invited Investors OnlyTheranos, Inc. · Investor Pitch Deck
Appendix C — Detailed P&L ($M)
Base case
| Line item | 2026 | 2027 | 2028 | 2029 | 2030 |
|---|---|---|---|---|---|
| Revenue | 50 | 180 | 420 | 900 | 1,800 |
| COGS | 21 | 68 | 147 | 288 | 540 |
| Gross profit | 29 | 112 | 273 | 612 | 1,260 |
| R&D | 25 | 50 | 80 | 120 | 160 |
| S&M | 15 | 40 | 80 | 140 | 220 |
| G&A | 9 | 17 | 33 | 52 | 80 |
| EBITDA | (20) | 15 | 80 | 240 | 620 |
| Depreciation | 5 | 10 | 18 | 28 | 40 |
| EBIT | (25) | 5 | 62 | 212 | 580 |
Source: company financial model (base case). Cash flow and balance sheet available in data room.
Confidential — For Invited Investors OnlyTheranos, Inc. · Investor Pitch Deck
Appendix D — Sources & Methodology
Data provenance
- Market sizing: Frost & Sullivan, Global Diagnostics Market Outlook 2026
- Competitive pricing: company research of public list prices (Quest, LabCorp, Abbott, 2026)
- Clinical data: company clinical study report (n=1,042), IRB-approved
- Financials: company operating model, base/bull/bear scenarios
- Regulatory: company regulatory strategy memo; FDA/CLIA public guidance
- IP: company patent docket (100+ filings)
All figures are company-provided and unaudited. Forward-looking statements subject to risk factors.
Confidential — For Invited Investors OnlyTheranos, Inc. · Investor Pitch Deck
BETO's Halloween — Event Card
Printable business card (front / back)
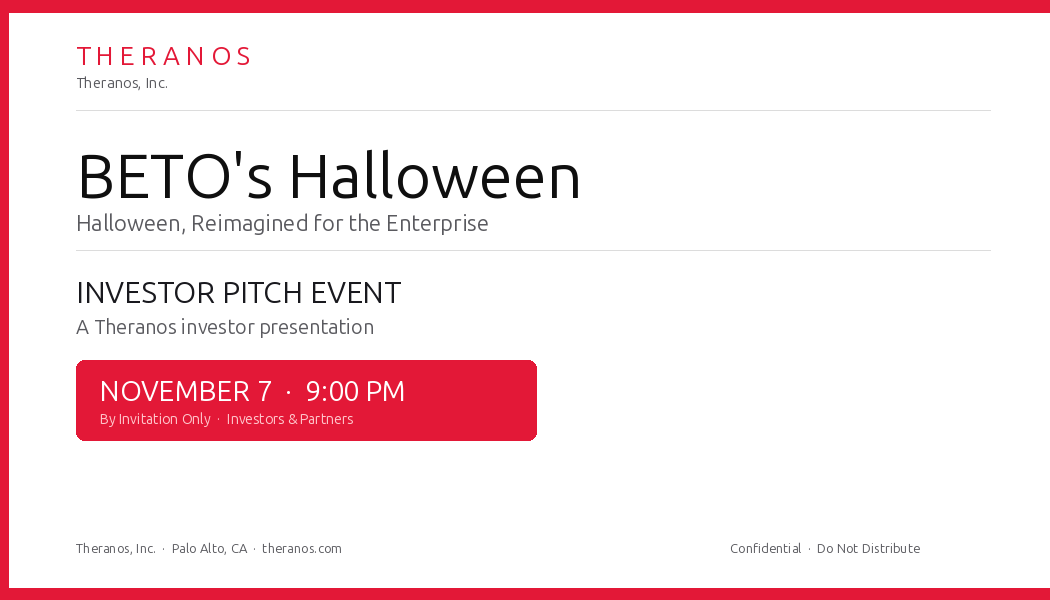
3.5" × 2" @ 300 dpi — print double-sided.
Confidential — For Invited Investors OnlyTheranos, Inc. · Investor Pitch Deck